
MBW’s Stat Of The Week is a series in which we highlight a data point that deserves the attention of the global music industry. Stat Of the Week is supported by Cinq Music Group, a technology-driven record label, distribution, and rights management company.
How much money do the three major music companies – answered this question, and we thought our readers were due an update. So we reached for the calculator.
Discovering what the three majors generate in revenue these days is made simpler because each of them has recently announced their calendar Q1 results (Universal here, here, and Warner here).
From there, MBW has translated each set of quarterly results from Universal (which announces its fiscal numbers in Euros) and Sony (which announces its fiscal numbers in Japanese Yen) into US Dollars at the average prevailing currency exchange rate of the quarter.
(Sony Group Corp provides this average rate; for Universal, we have used the average quarterly EUR-USD figure for Q1 2023 identified by the European Central Bank).
Warner Music Group announces its results to the market in USD.
Below you can see what each of the three major music companies generated in revenues across four categories:
- (i) ‘Recorded Music + publishing etc’: This brings together all recorded music revenue streams for the majors, with music publishing revenues, plus ancillary revenues from operations such as merch and concert ticketing. (Sony’s ‘Visual Media + Platform’ revenues have been omitted, as explained here.)
- (ii) Music Publishing: As you’d expect, all revenues attributed to music publishing in the quarter;
- (iii) Recorded music: As you’d expect, all revenues attributed to recorded music by each company in the quarter;
- (iv) Recorded music: Streaming: As you’d expect – all revenues attributed to streaming within the recorded music operation of each company in the quarter. Note: This figure includes both ad-funded and subscription streaming revenue.
(Small note worth knowing: Sony’s results below, via Sony Group Corp, are global, so include the performance of its autonomous recorded music and music publishing companies in Japan, as well as in the rest of the world.)
(Also worth knowing: The below represents revenues as corporately reported by the majors, and typically includes revenues generated by distributed partners.)
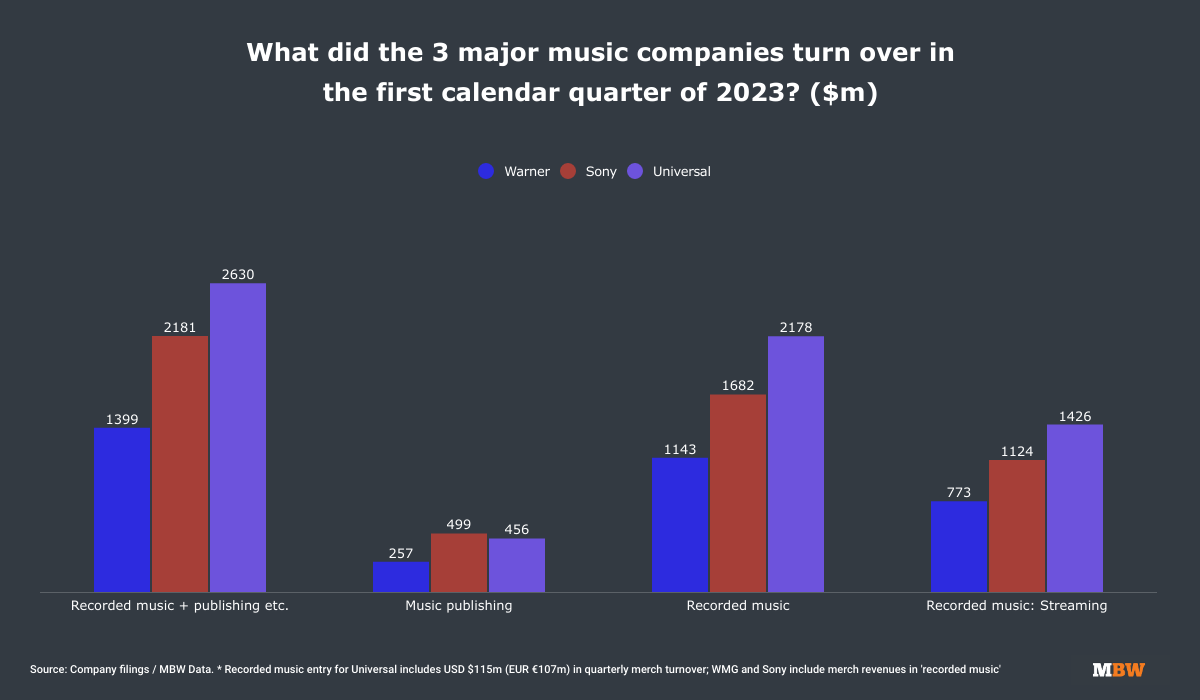
As you can see, collectively across their music rights operations (including recorded music plus music publishing plus ancillary revenues), the majors cumulatively generated USD $6.21 billion in the first three months of the year.
That works out to approximately $69 million per day, or just under $2.9 million every hour.
And just for fun: It also works out to approximately $48,000 every minute… or $800per second.
In terms of recorded music alone (including merch and other ancillary revenues), the three majors generated $5.00 billion in the first three months of 2023.
That works out to approximately $56 million per day, or just over $2.3 million every hour.
That’s also approximately $39,000 per minute… or $648 per second.
And in terms of recorded music streaming revenues alone, the three majors collectively generated $3.32 billion in the first three months of 2023.
That works out to approximately $37 million per day, or $1.5 million per hour.
That’s also approximately $26,000 per minute… or $433 per second.
Year-on-year revenue growth at the majors is still healthy, but, right now, not keeping up with the substantial double-digit YoY increases we once saw.
In calendar Q1, Universal Music Group saw 9.6% YoY revenue growth in recorded music; Sony saw 10.5% YoY revenue growth in the same category; and Warner’s recorded music revenues bounced by 2.5% YoY. (All constant currency.)
With $6.2 billion in revenue secured in Q1, can the majors now go on to jointly top $25 billion in annual revenue in 2023?